Showcasing Regional Tourism: Data-Driven Insights
Bespoke Product
February 2025

Showcasing Regional Tourism: Data-Driven Insights
Overview
Décor Data collaborated with a leading regional tourism organisation to modernise and enhance how they present visitor economy insights. Leveraging Power BI and advanced data storytelling techniques, we transformed static reports into dynamic, interactive dashboards that allow tourism stakeholders to better understand visitor trends, spending patterns, and economic impacts.
Challenge
Tourism organisations collect vast amounts of visitor data from surveys, industry research, and government sources. However, the challenge lies in communicating these insights effectively—ensuring that local councils, businesses, and investors can easily access, interpret, and act on the data.
Traditional reports, while informative, often lacked interactivity, real-time updates, and accessibility for diverse stakeholders. The organisation needed a solution that could:
- Standardise visitor reporting while allowing flexibility for different regional councils.
- Visualise key metrics such as visitor numbers, spending trends, and trip purposes in a clear and compelling way.
- Ensure ease of use for tourism boards and policymakers who rely on this data for funding decisions.
Solution
Décor Data developed a custom Power BI solution tailored to the organisation’s needs. Key elements of the solution included:
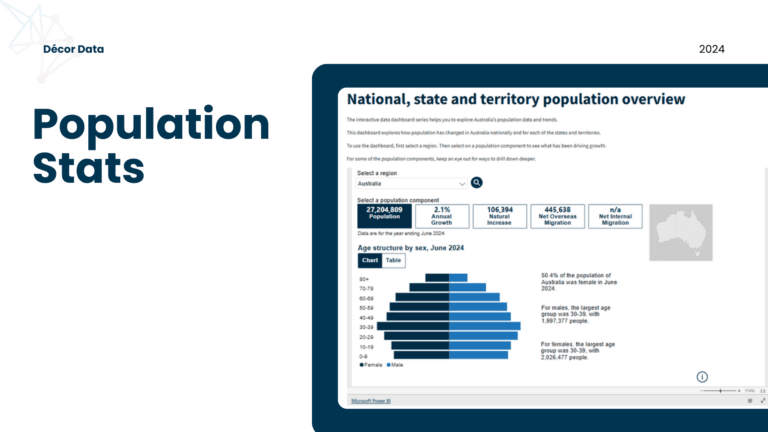
- Interactive Dashboards: We built dashboards that visualise visitor trends over time, breaking down key statistics such as overnight vs. day trips, market share, and purpose of visit.
- Automated Data Pipelines: By integrating data from multiple sources, including Tourism Research Australia and regional survey data, we ensured real-time updates without manual data entry.
- Custom Report Templates: To maintain consistency, we created branded report templates that regional councils could easily adapt to their local visitor data.
- Demographic & Economic Insights: Our solution included segmentation tools, allowing tourism boards to filter insights by visitor origin, household income, and preferred activities.
- Export & Accessibility Features: Reports were designed with accessibility in mind, including options for PDF exports and mobile-friendly views.
Value-Add
Our work provided tangible benefits to the regional tourism organisation, including:
- Data-Driven Decision Making: Improved ability to attract funding and investment by demonstrating visitor growth and economic impact.
- Efficiency & Automation: Eliminated manual reporting inefficiencies, reducing report preparation time by 50%.
- Stakeholder Engagement: Enhanced the organisation’s ability to share insights with local councils, hospitality businesses, and policymakers.
- Scalability: A flexible framework that can be adapted for other regional tourism boards and visitor economies.
Conclusion
This project showcases how data and analytics can empower regional tourism organisations, making insights more accessible, actionable, and engaging. By transforming visitor data into interactive, standardised reporting, Décor Data has helped regional stakeholders harness the power of data to drive tourism growth and economic resilience.