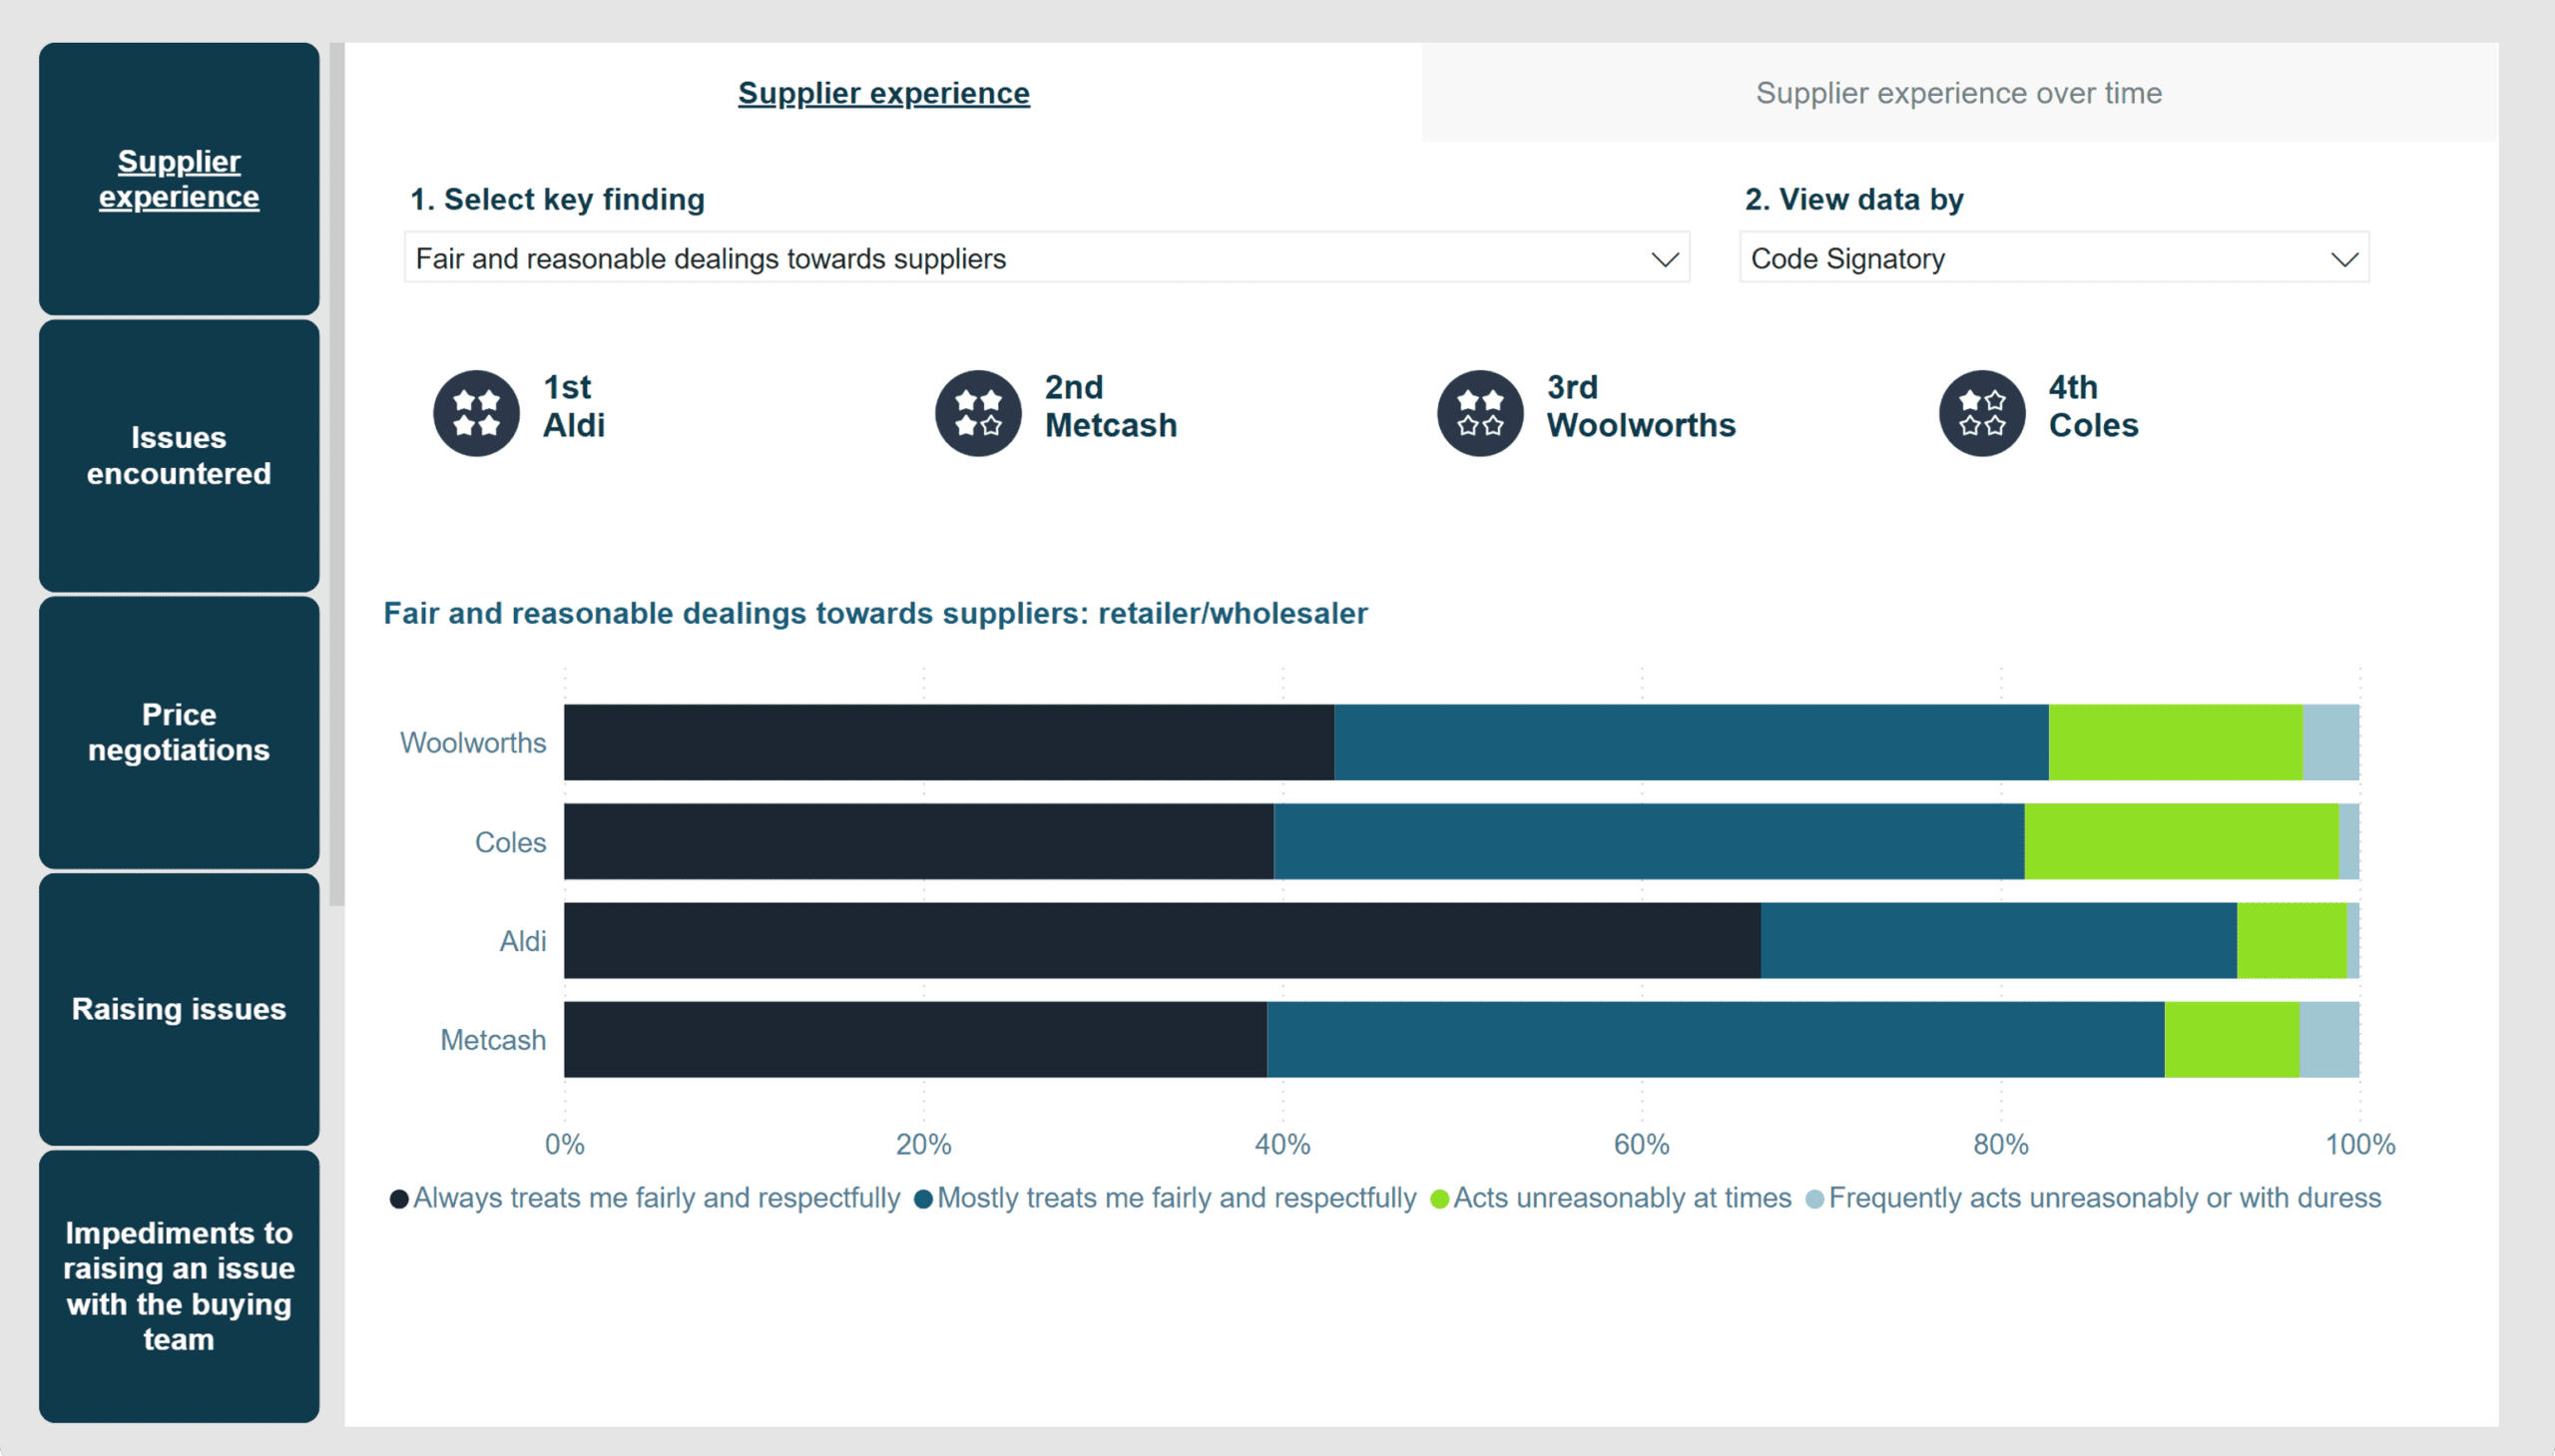
Grocery Code Survey Interactive Power BI Dashboard
Bespoke Product
March 2024
https://grocerycodereviewer.gov.au/reports/annual-reports/2022-23-annual-report
Revolutionising Data Access
Overview
Décor Data, in collaboration with a leading government regulatory body, initiated a groundbreaking project within the Australian grocery sector to introduce the first-ever public Power BI dashboard focused on the Grocery Code Survey. This project aimed to revolutionise access to crucial data on commercial dealings between grocery retailers/wholesalers and suppliers, with the primary objective of fostering competition and promoting healthier relationships among stakeholders.
The Problem
Décor Data faced the significant challenge of developing the inaugural Grocery Code Survey Interactive Power BI Dashboard, requiring technical expertise and innovative thinking to present complex survey results effectively. It demanded a departure from traditional data dissemination methods and integration of cutting-edge technology with strategic vision.
Our Solution
Leveraging expertise in Bespoke Product Creation, Décor Data tailored solutions using Microsoft Power BI, DAX Studio, and Tabular Editor. Requirements were meticulously gathered to develop an interface allowing public members to draw insights from the Food and Grocery Code Independent Reviewer’s annual supplier survey data. Key metrics, user personas, and workflows were identified, ensuring the dashboard catered to various levels within the grocery sector.
Content Creation Journey
- Data Integration: Décor Data ensured data accuracy and consistency by seamlessly integrating diverse data sources related to the Grocery Code Survey, providing a comprehensive industry view.
- Visualisation Techniques: Employing cutting-edge techniques, visually captivating dashboards aligned with Web Content Accessibility Guidelines were crafted, making complex data easily comprehensible.
- Interactive Features: Seamless filtering of data by hierarchy enabled enhanced user engagement, aligning with digital communication objectives and fostering deeper insights.
- Accessibility Standards: Adherence to WCAG standards ensured usability for all, promoting equitable access to critical data.
- Consistency and Transparency: Maintaining consistency and transparency in content presentation set a new standard for data dissemination practices.
- Performance Optimisation: Streamlining data loading processes and optimising visualisations significantly enhanced dashboard performance, even with large datasets.
- Innovative Content Formats: Strategic leveraging of innovative formats deepened user engagement and comprehension, empowering informed decision-making.
In Conclusion
Décor Data’s efforts culminated in the successful launch of the Grocery Code Survey Interactive Power BI Dashboard. Revolutionising access to critical information, it promoted competition and healthier relationships across the grocery sector. Its main benefit lies in allowing the public to draw insights and track performance, serving as a powerful tool for stakeholders. Setting a precedent for future digital initiatives, Décor Data demonstrated a commitment to innovation and advancing data accessibility.